The principal finding
Calendar choice changes the sign of the comparison.
Validation brief →Financial strategy validation · nine sector ETFs · 2001–2025
Calendar Timing, Trading Costs, and Reproducible Backtests
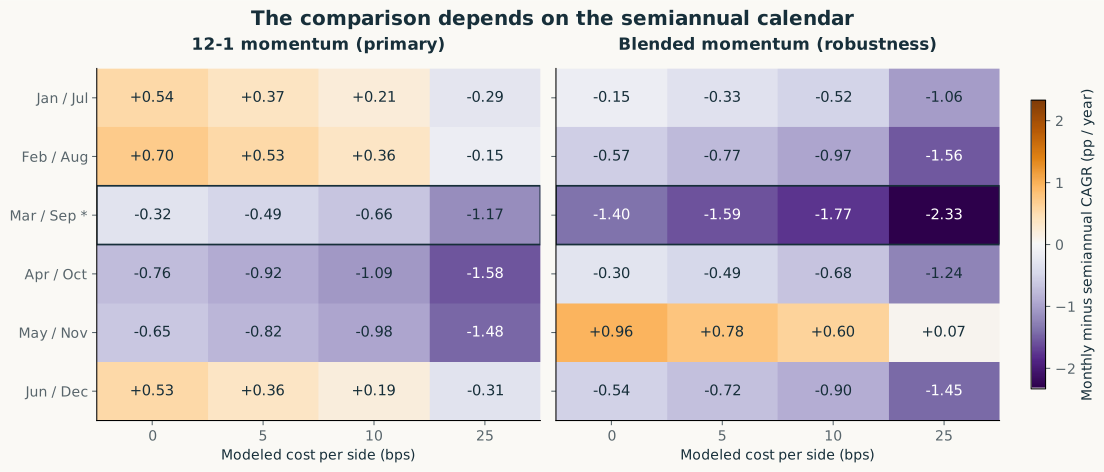
The monthly–semiannual comparison changes sign when the semiannual calendar changes.
At 5 bps per side, the 12–1 CAGR difference ranges from −0.92 to +0.53 percentage points per year across six schedules. The designated March/September comparison is −0.49.
Claim → evidence → checks → judgment
The six-sleeve tranche returns 8.24% CAGR, versus 8.02% monthly. Its maximum drawdown is deeper, at -40.91%. Both primary paired 95% intervals cross zero.
The evidence supports sensitivity to the chosen calendar. It does not establish a general frequency ranking or show that pooling eliminates risk.
Inspect estimates and uncertainty →Calendar choice changes the sign of the comparison.
Validation brief →Tranche paths, risk, costs and paired intervals.
Study results →Lineage, independent calculations and residual risk.
Methods & memo →Accounting and Logistics Management training, followed by Business Analytics and AI study, provides the context for this project: careful measurement definitions, account reconciliation and evidence-based judgments.
This project asks what remains of a strategy claim after checking its assumptions, implementation and uncertainty. The same approach can be applied to model evaluations: define the claim, inspect the evidence, test failure modes and qualify the judgment.
“I test whether models and strategies actually work — and publish when they don’t.”
The owner selected the validation focus, personally reconciled one trade and reviewed results and evidence limits in writing. AI assisted implementation and drafting. Exact signal-window explanation and observed oral presentation remain pending.
The fixed-cohort stock pilot is a separate case with a shorter window and different data assumptions. The original 75-stock design is archived as incomplete research history after its stricter data requirements could not be met.
Retrospective vendor-adjusted price and next-open proxies; fixed costs, zero-interest cash and changing ETF sectors. The same agent authored the separate implementations. Source prices and achievable fills remain unverified, and personal mastery requires actual owner review.